Note
If you have any lingering questions or confusion on the material covered in this guide, it's recommended that you reach out on piazza or attend office hours.
Wireshark is a open-source and free way to anaylze your network traffic. The network traffic captured are called packets which are encapsulated starting from the application layer all the way down to the link layer or physical layer for the OSI model. This tool allows you to inspect and anaylze your VMs network traffic in-real time. The packets captured contain detailed information that may be helpful to you such as where the packet came from, where it's going to, and the content of the packet itself(If it's not encrypted).
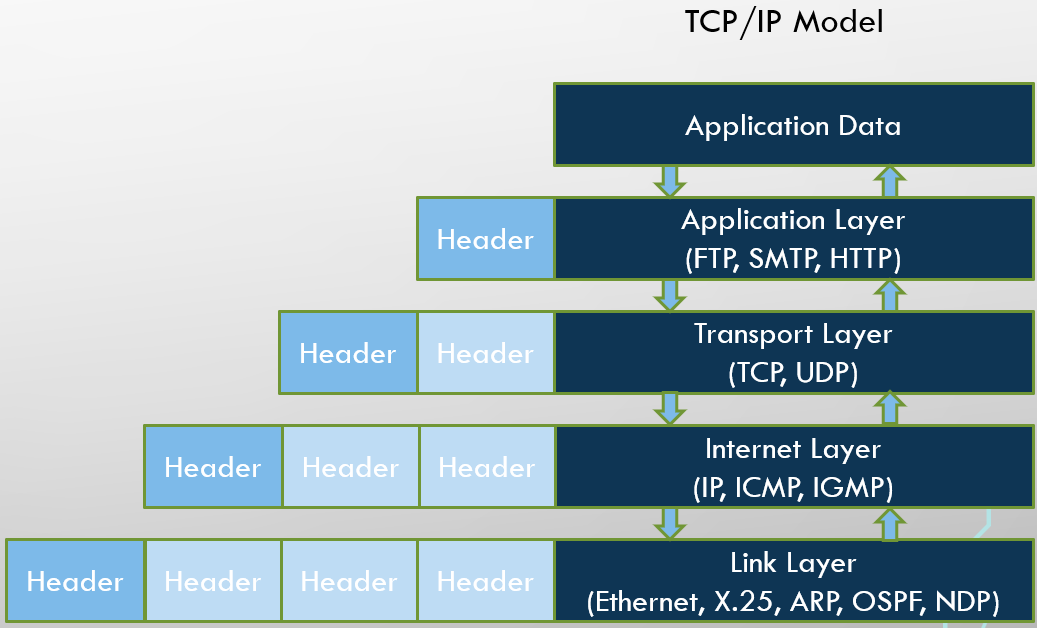
Here's an example of how packets are encapsulated represented as the TCP/IP Model:
This guide serves as an introduction or re-introduction to Wireshark and hopfully provide helpful tips and tricks on your newtorking labs. For the rest of this guide you will learn how to locate wireshark on your VMs, navigate its UI to filter for specific packets, and most importantly inspecting captured packets.
Additional, this guide contains an interactive demo where you can follow along on your VMs since the main labs that use Wireshark are TCP Attack and Sniffing and Spoofing. Also, feel free to use Wireshark on your other labs for this course but it's not strictly necessary.
If you have any lingering questions or confusion on the material covered in this guide, it's recommended that you reach out on piazza or attend office hours.
Besides that, let's get started!
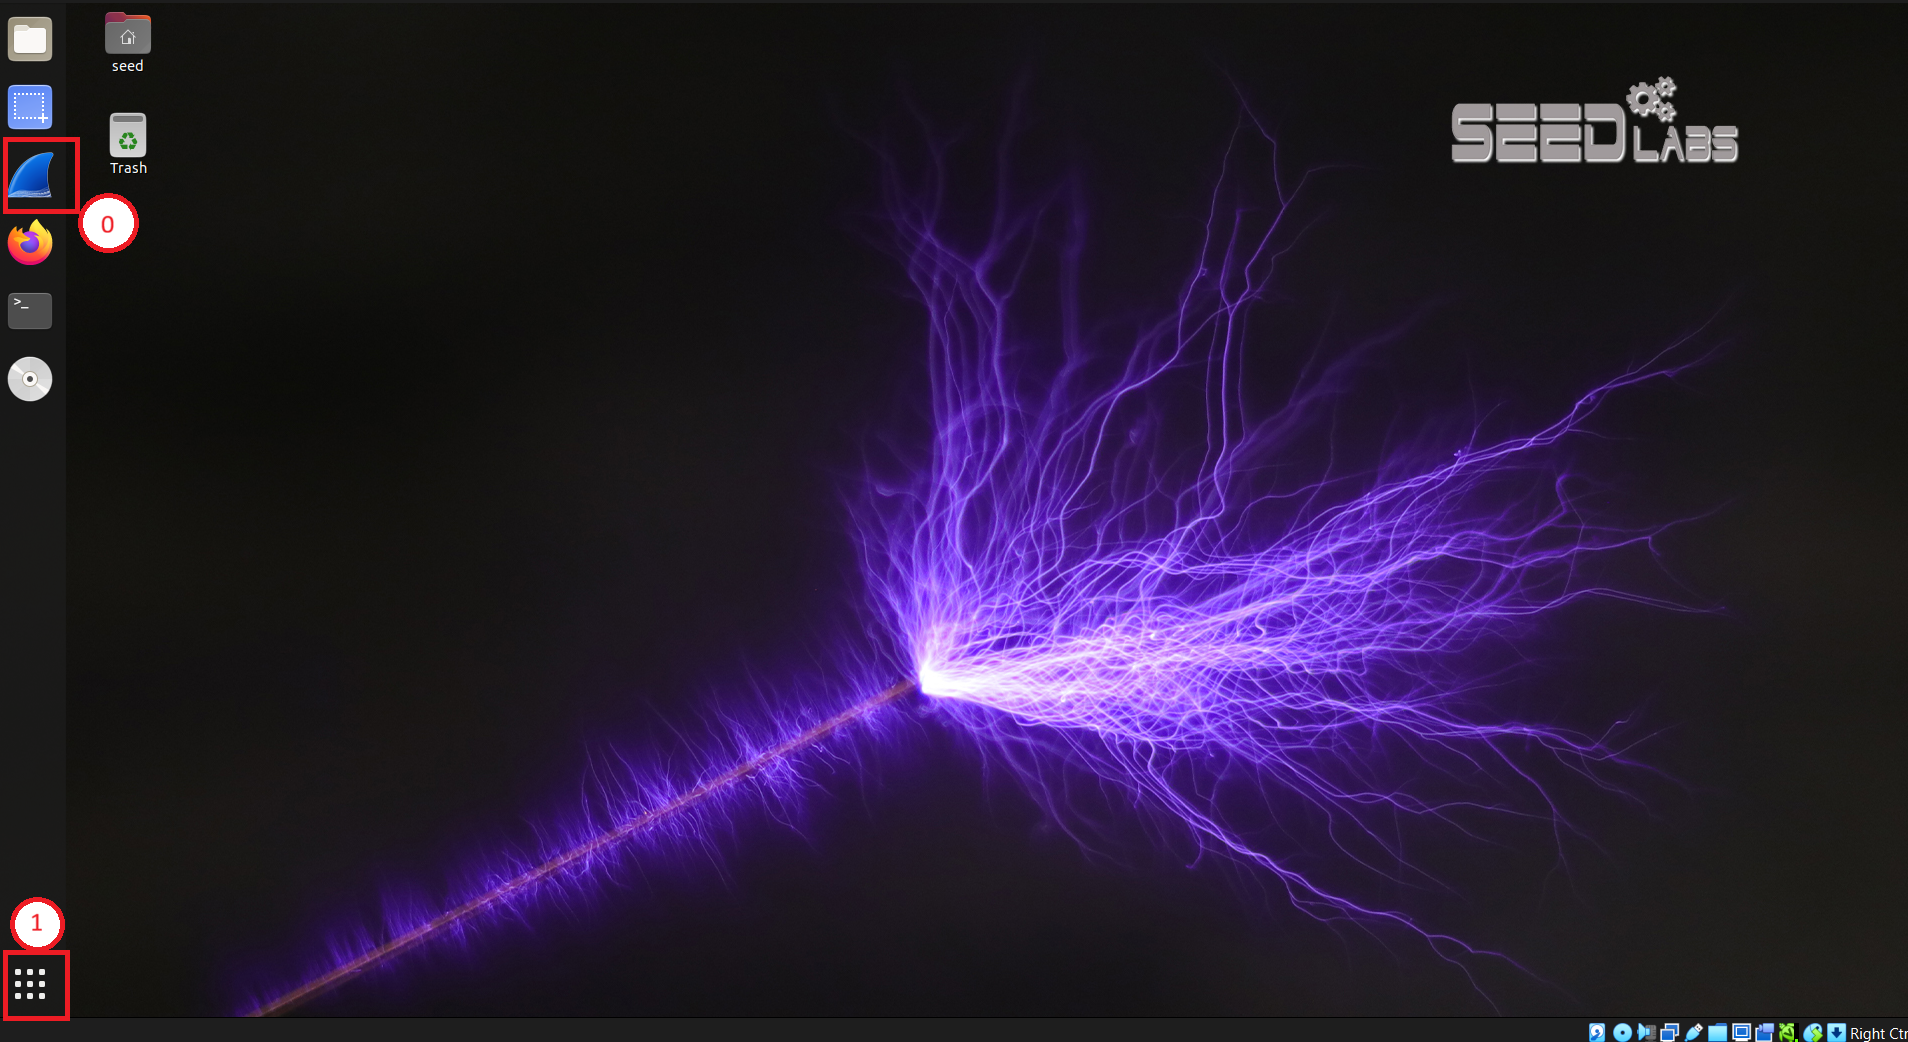
Wireshark should already be installed on your VM and it's a blue shark fin icon located on your left side menu
Once Wireshark is open, confirm that you have been brought to screen shown below
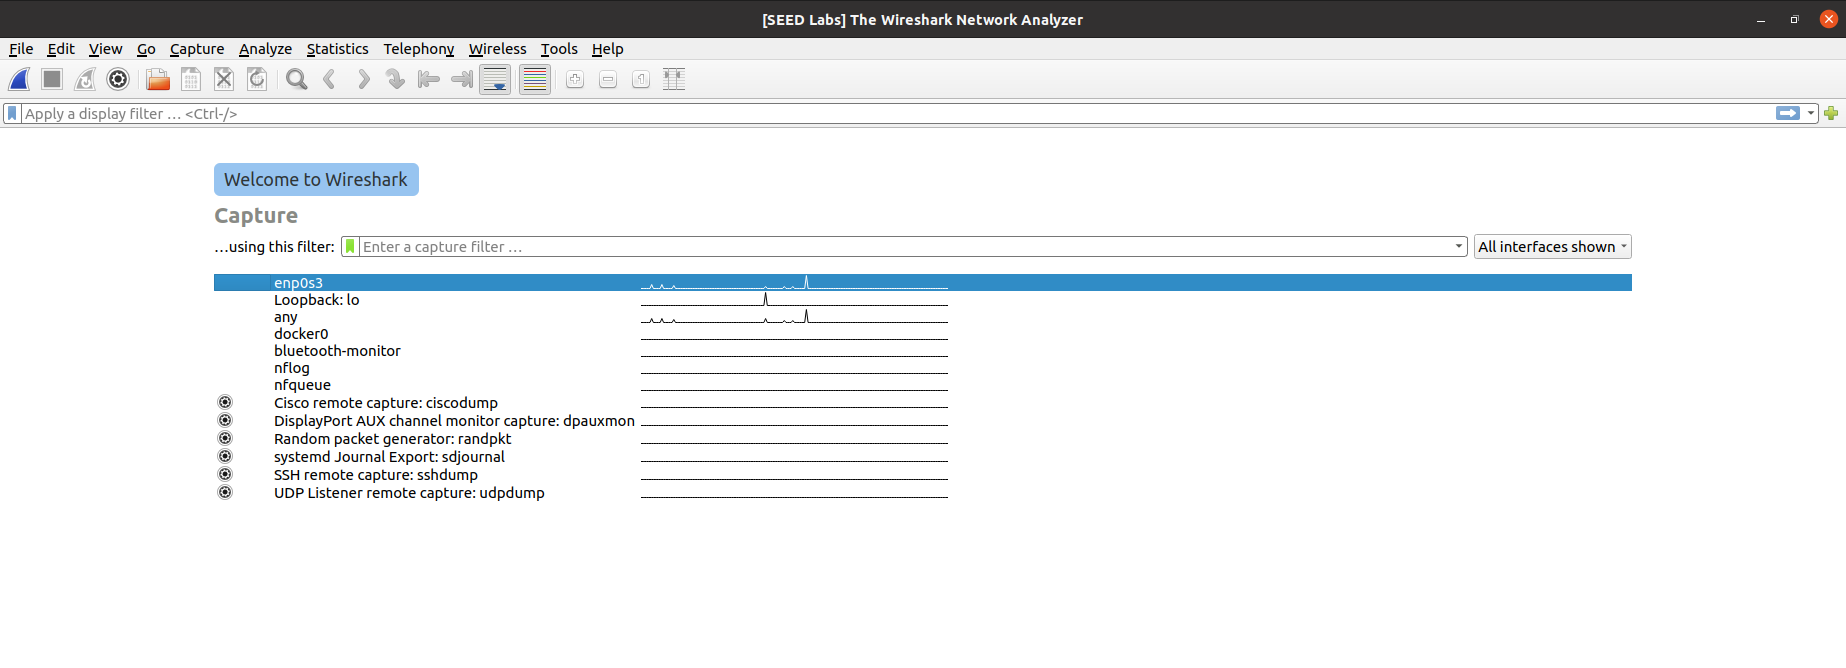
The screenshot above shows the network interfaces that you can select for Wireshark to filter network traffic on. Since your networking labs use docker containers for victim and attacker machines selecting the any filter option is recommended.
While using Wireshark during your labs there will be a lot of packet wizzing by and it can be overhelming/confusing to find the packets you are looking for.
Now we will use Firefox as our demo in this guide. Once The Firefox page loads, scoll to the Top and click the first packet.
Below is a screenshot of Wireshark when a Firefox browser is opened:
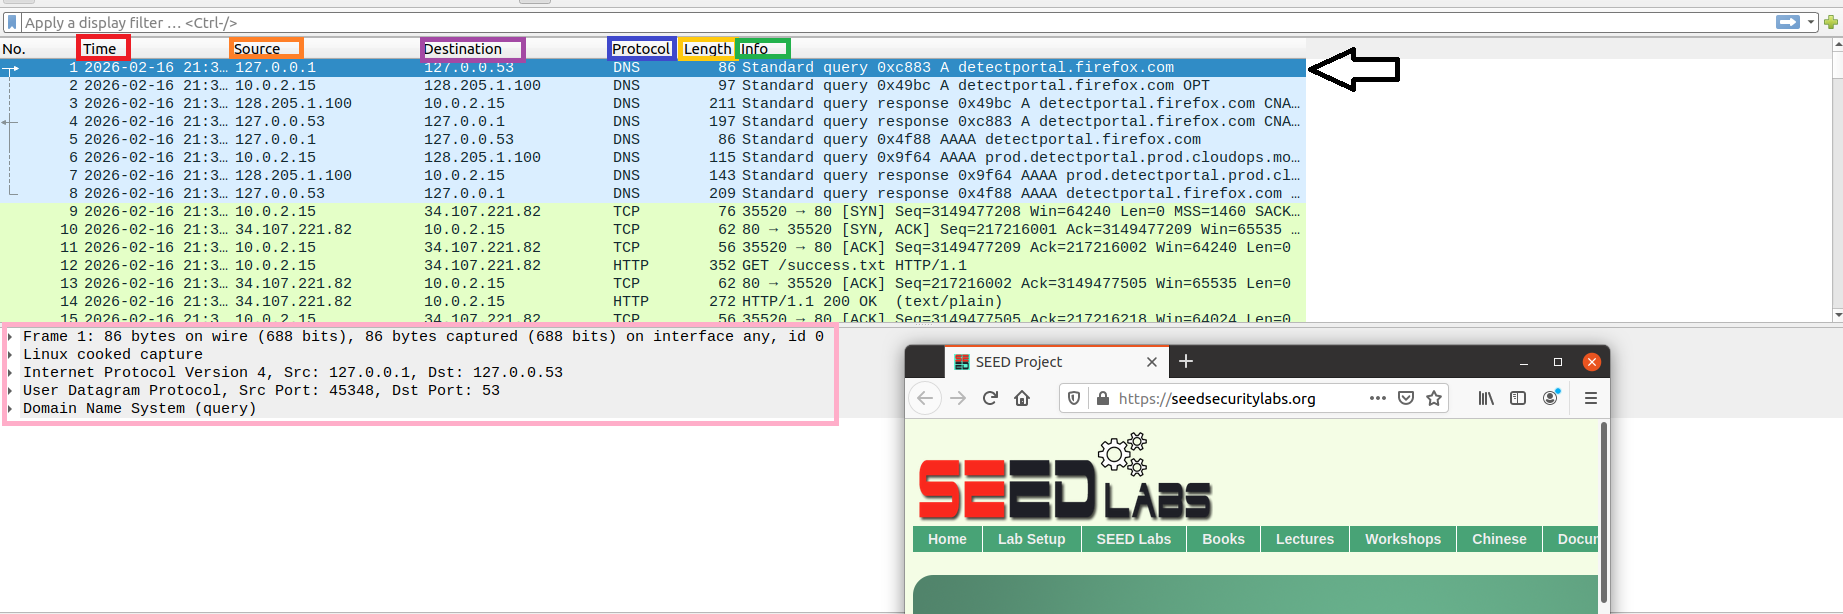
Let's breakdown the screenshot above into parts starting from Left to right.
The
The
The
The
The
The
The

Next, the
We will touch on this more in the next section of this guide.
Contiuning from the demo used in the previous sectoin, let's inspect a TCP packet to find more information about it like the sequence number.
First, select the first TCP packet you see in a similar way from the image below:
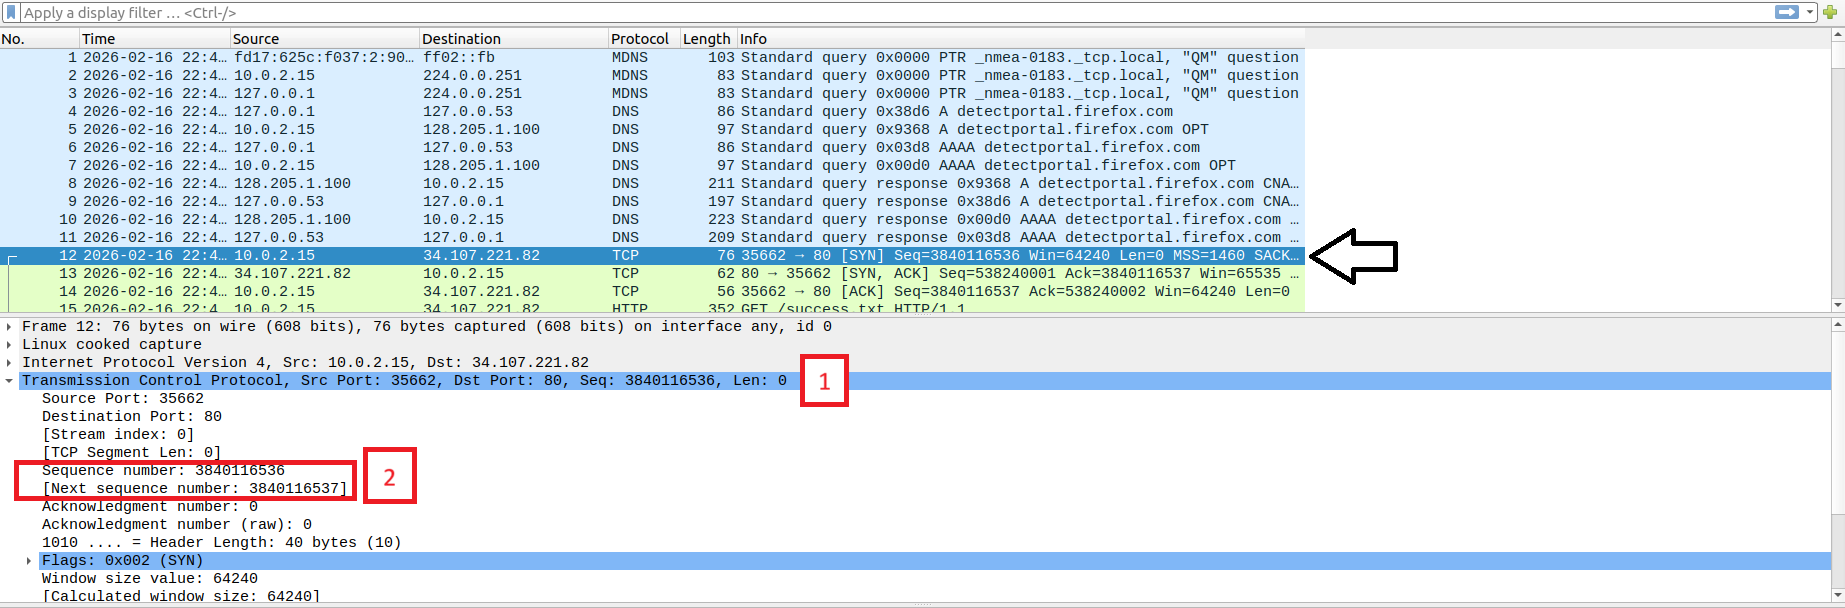
Next, let's select the drop down menu denoted in
Here, we can view the sequence number in the
Additionally, if you scoll a bit further down you can see the flags set for the TCP packet. In this example it was the SYN flag which is the first flag sent in the 3-way handshake(SYN, SYN+ACK, ACK)
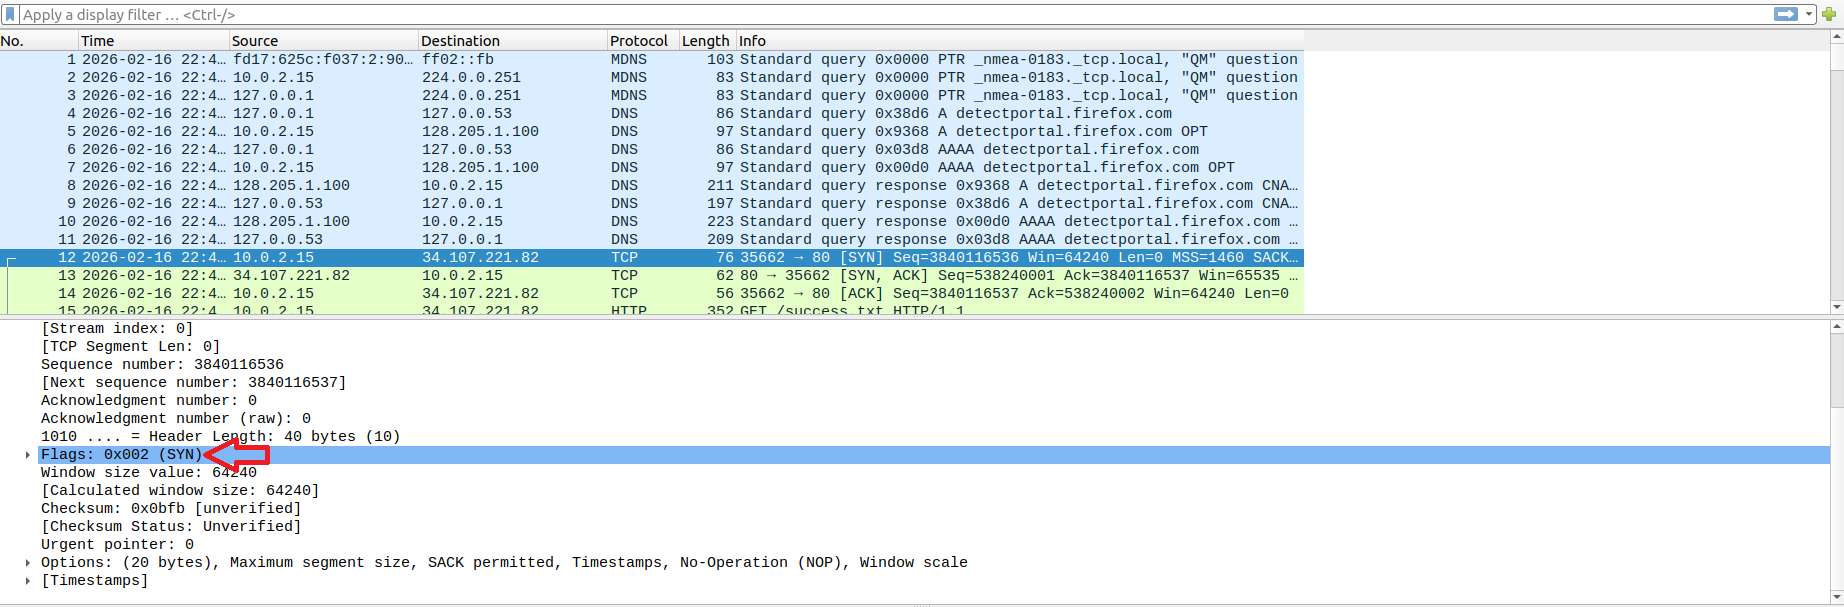
In this example the next sequence number is generated for you and this information may be useful in your labs(Wink).
As you start using Wireshark during your labs, there will be a lot of packet wizzing in the main source window and it can be overhelming/confusing to find the packets you are looking for.
That's why using filters for a specific protocol, IP address, or port can help mitgate the visual clutter when using Wireshark if it's your first time.
Let's do an example by searching for your VMs IP address using the ip.addr filter
In the image below the
The search bar is highlighted in green which means that the filter expression is valid otherwise it will be shown in red for errors. The 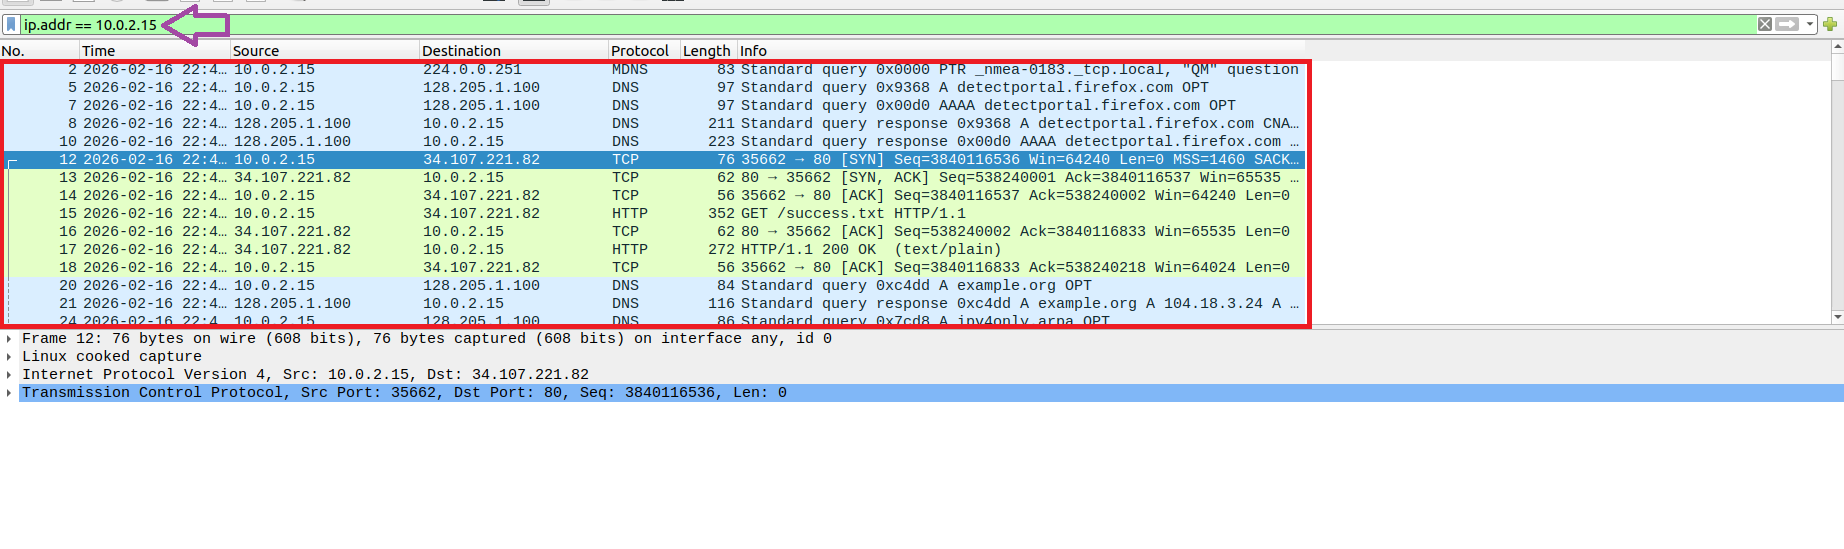
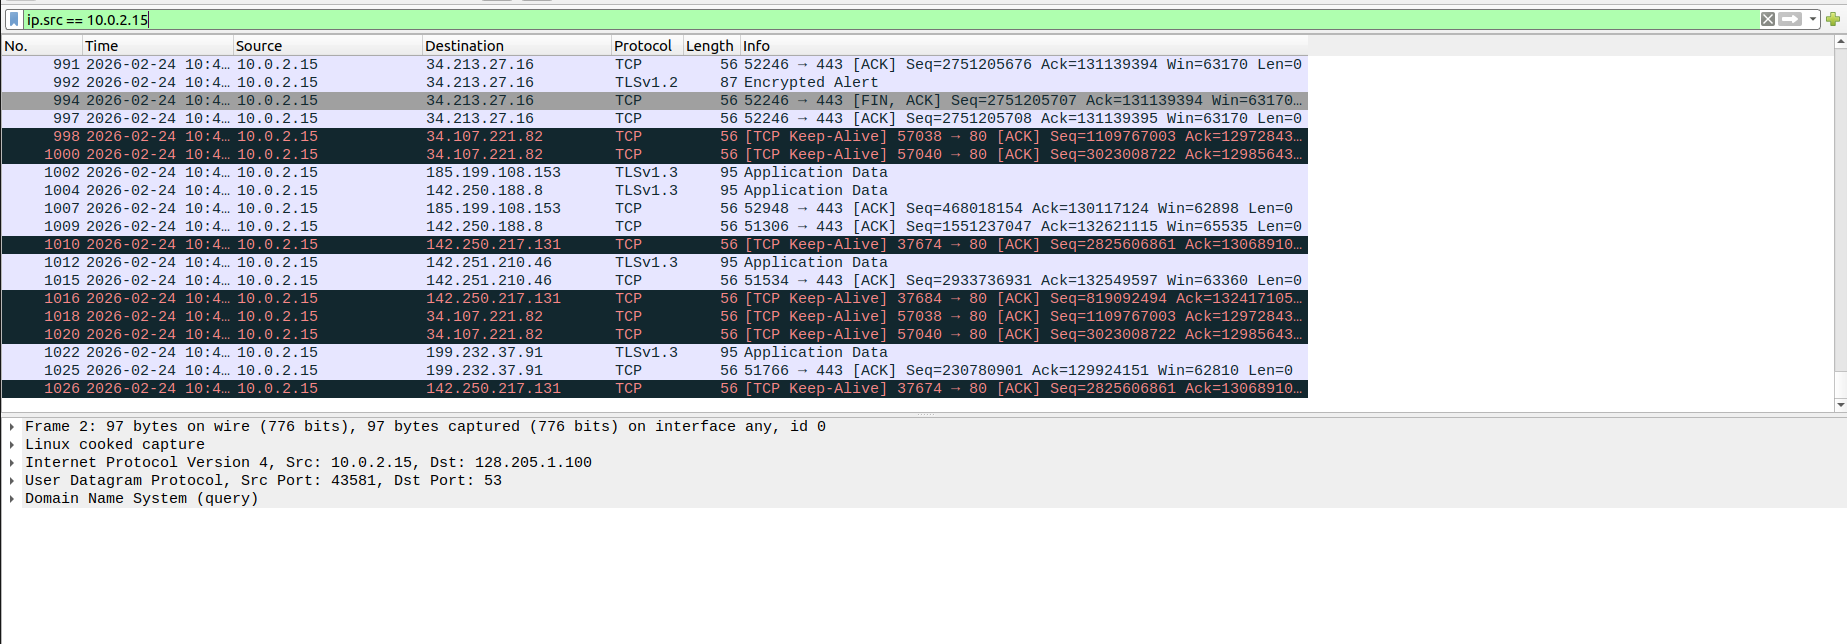
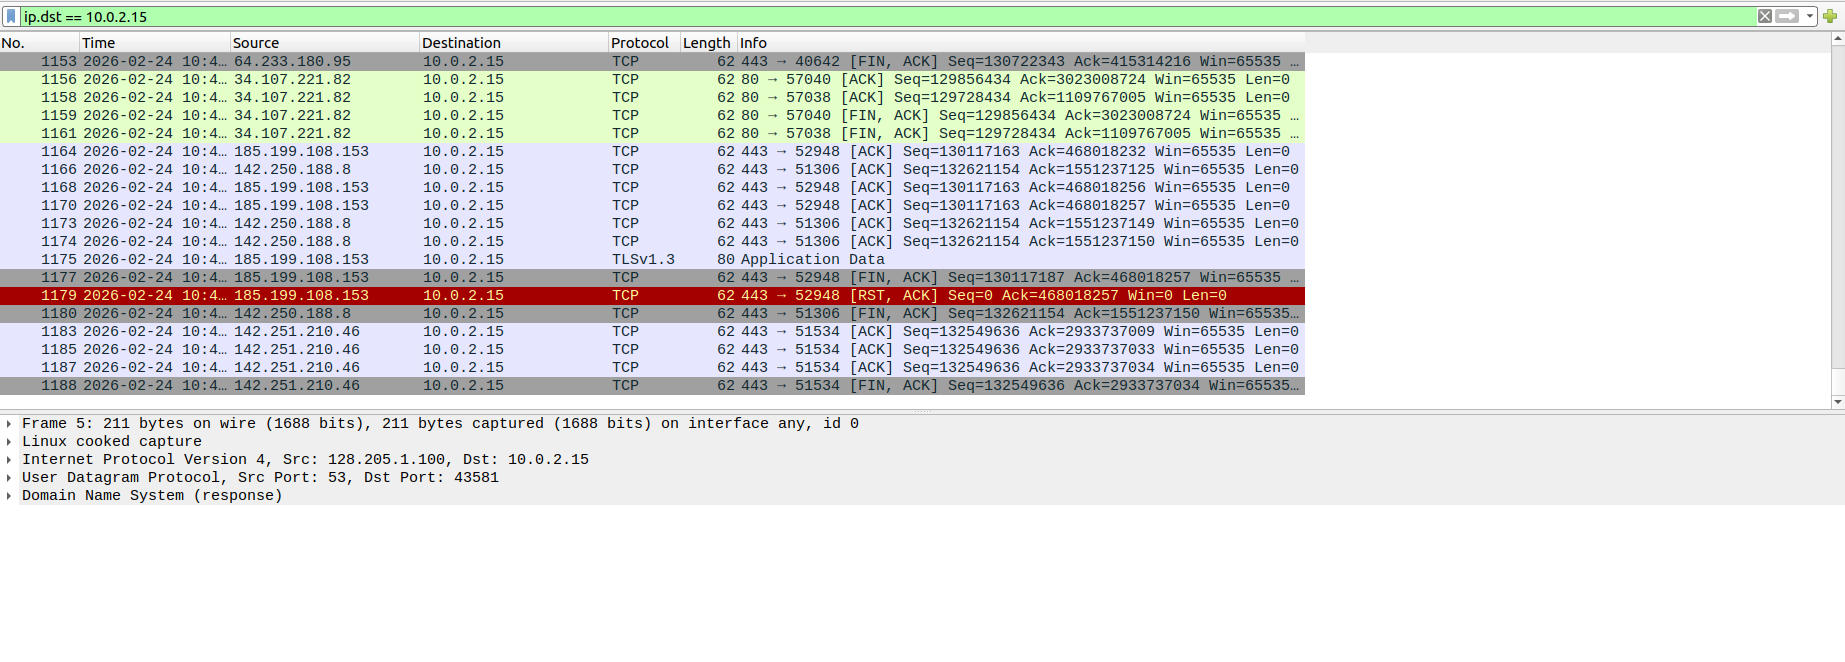
In Addition, you can use the following expressions to specify the source/destination IP address respectively as an example:
ip.src == 10.0.2.15
ip.dst == 10.0.2.15
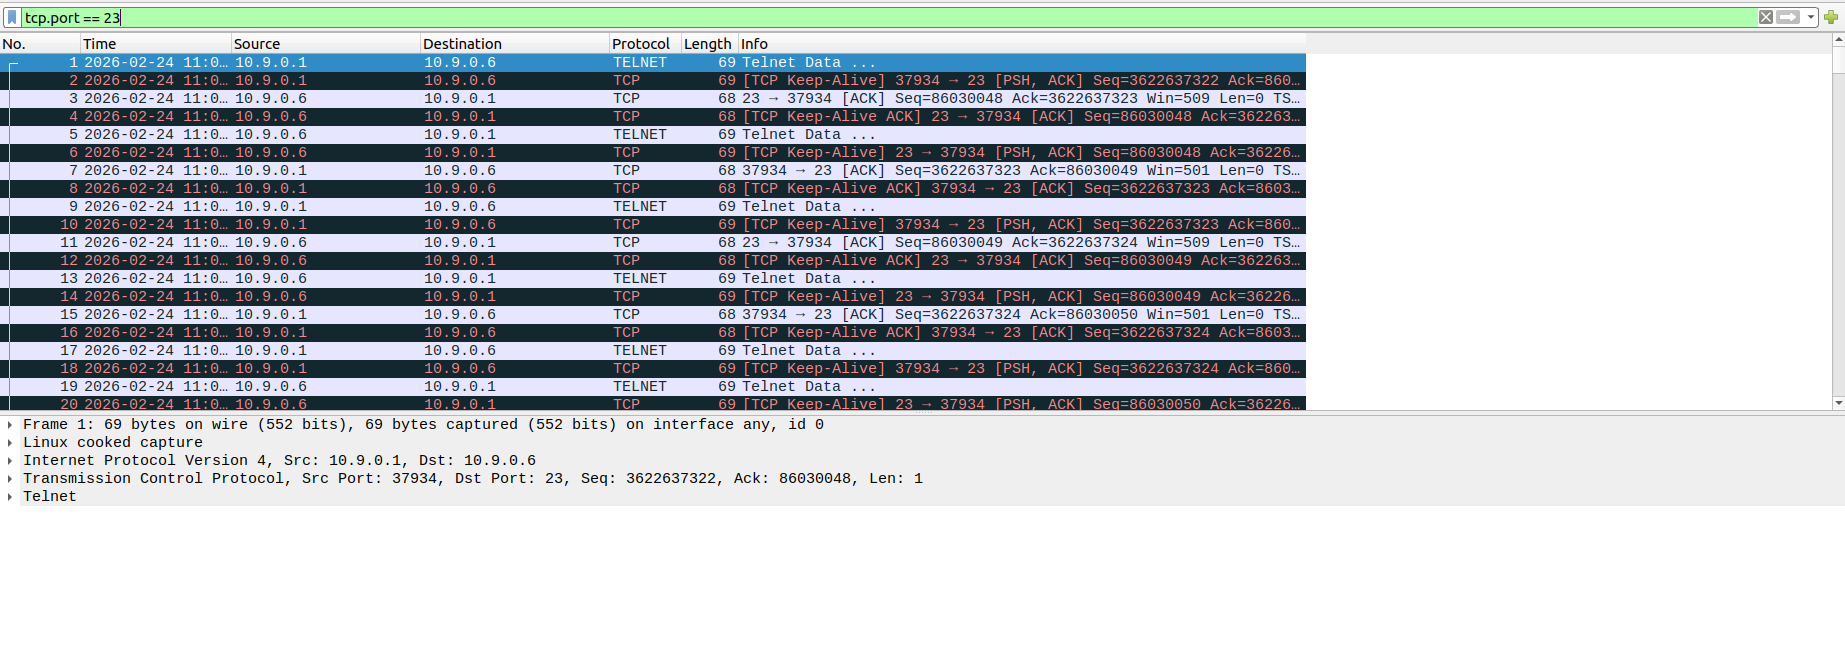
If you wanted you a filter
tcp.port == 23
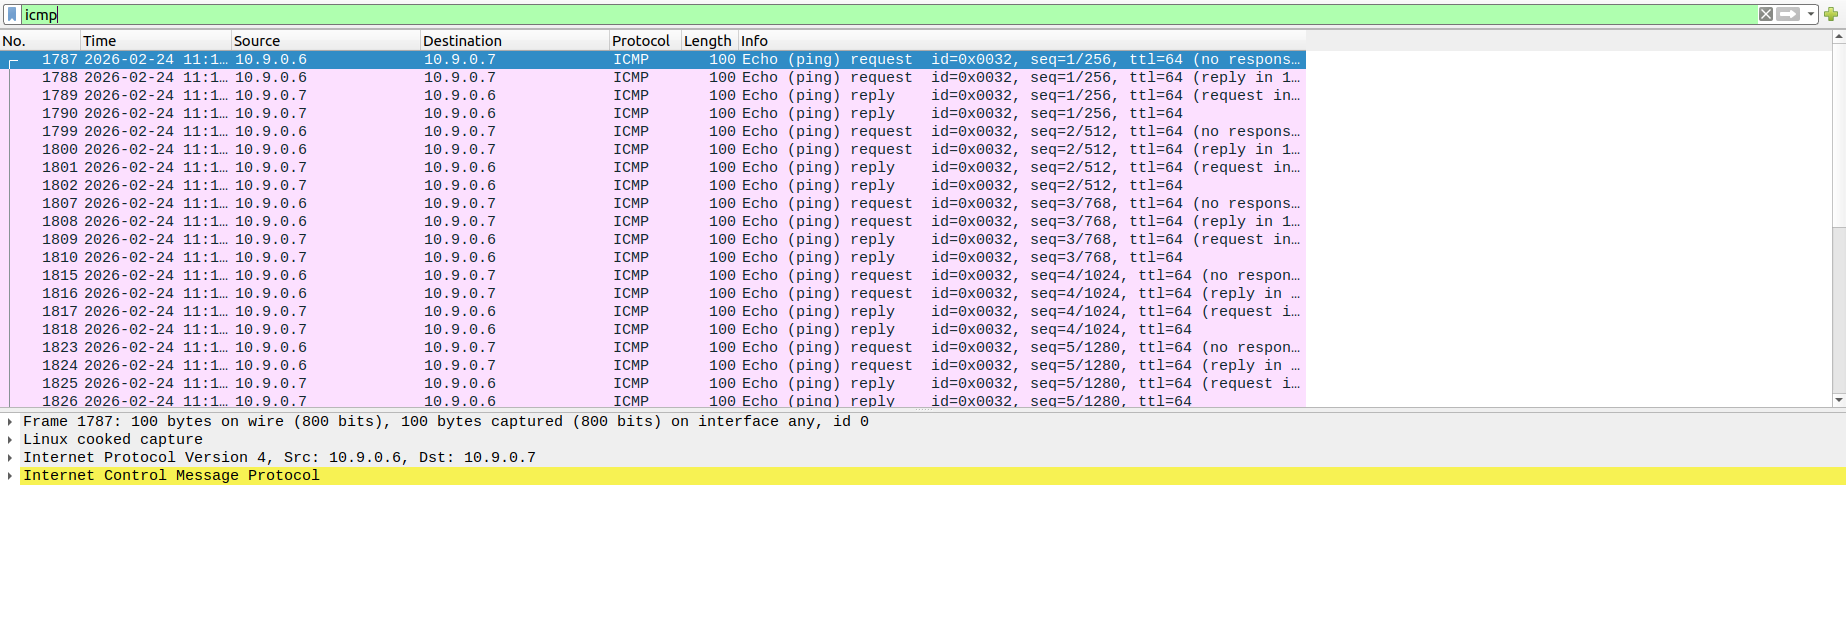
Alternatively, you can search for specific protocols
icmp
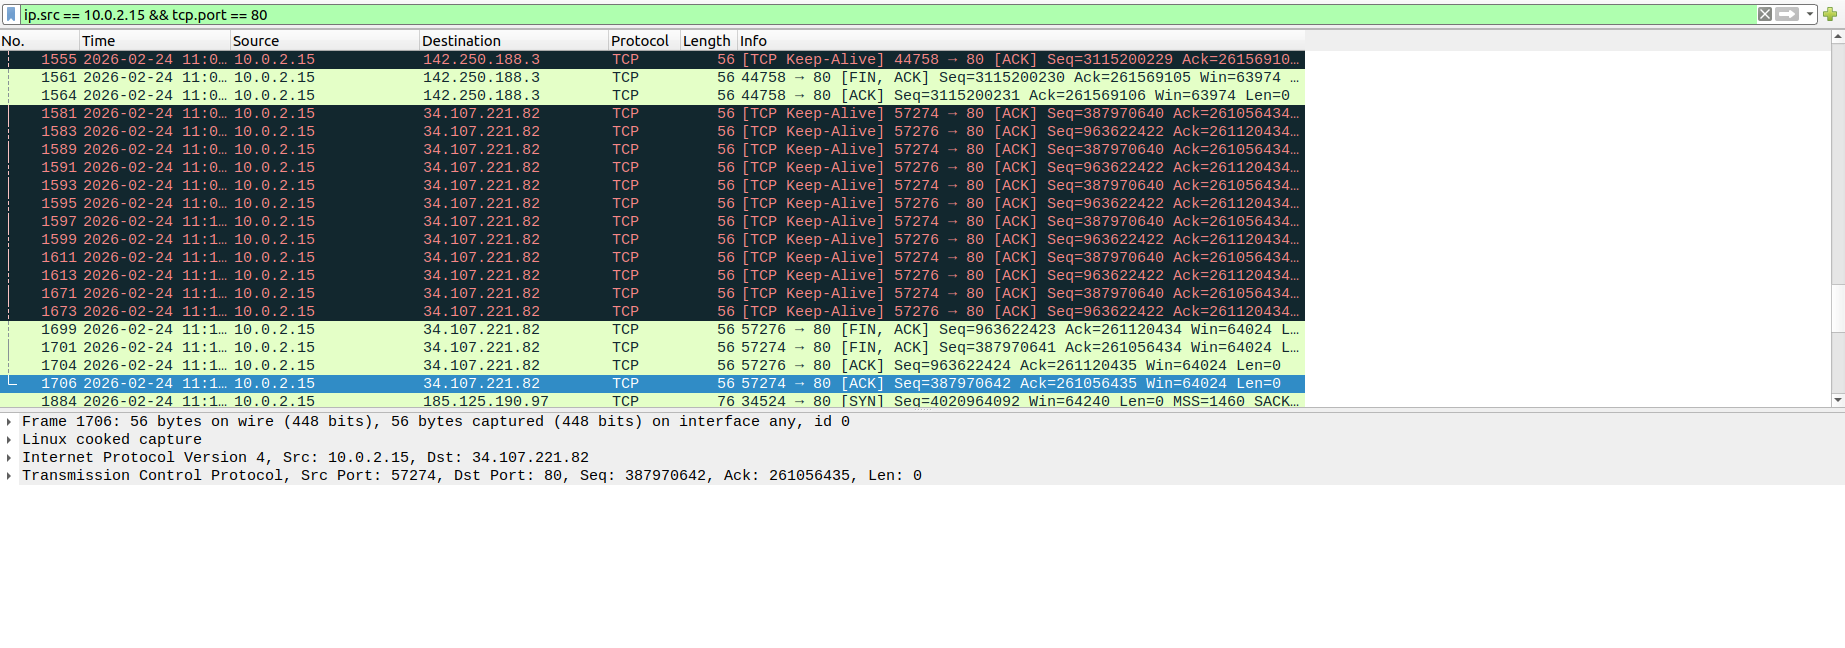
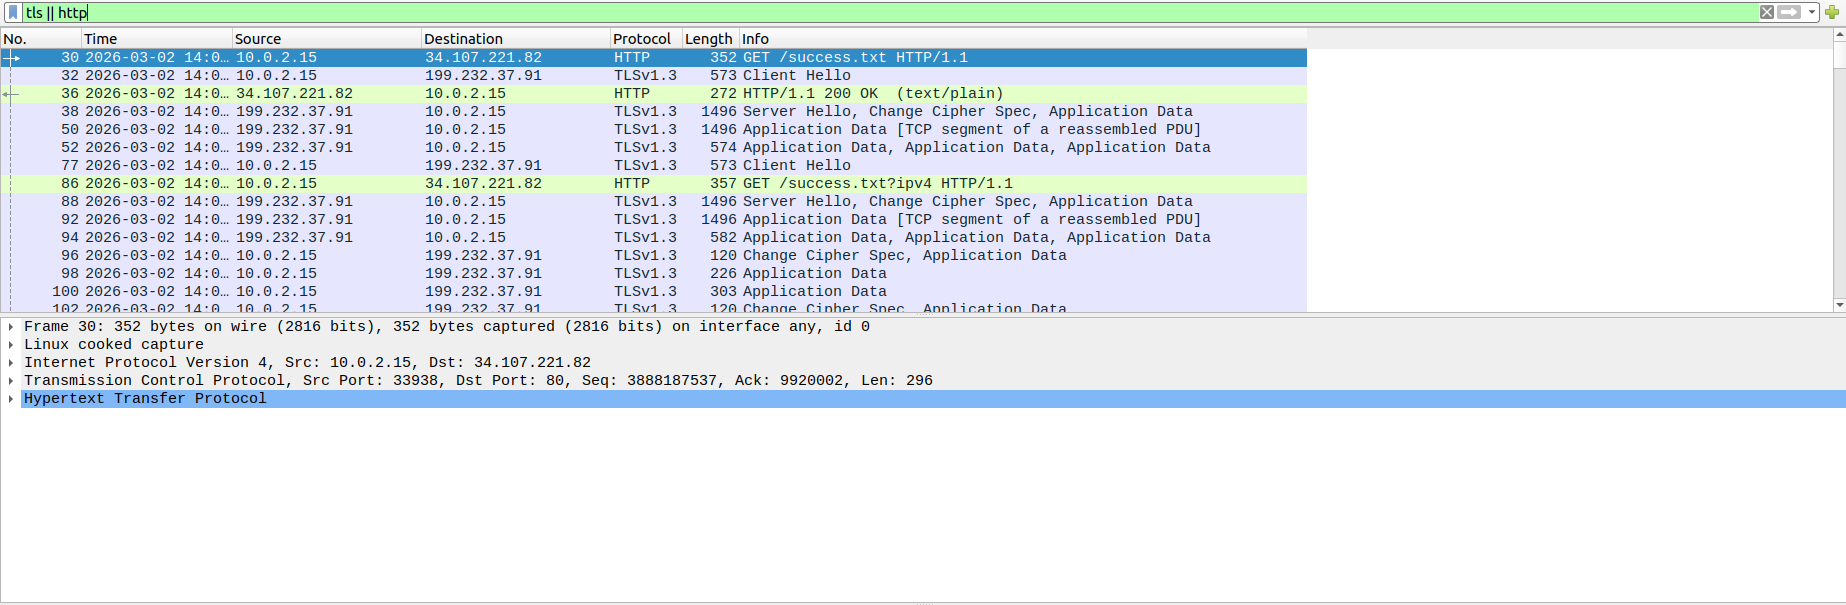
Lastly, we can filter using logical operators using logical and(&&) and logical or(||) to combine filter expressions. Below are examples of how to uses these expressions.
ip.src == 10.0.2.15 && tcp.port == 80
tls || http
For any filter expression you are to use make sure its a valid expression. A valid expression will be hightlighted in
Here's an example of a 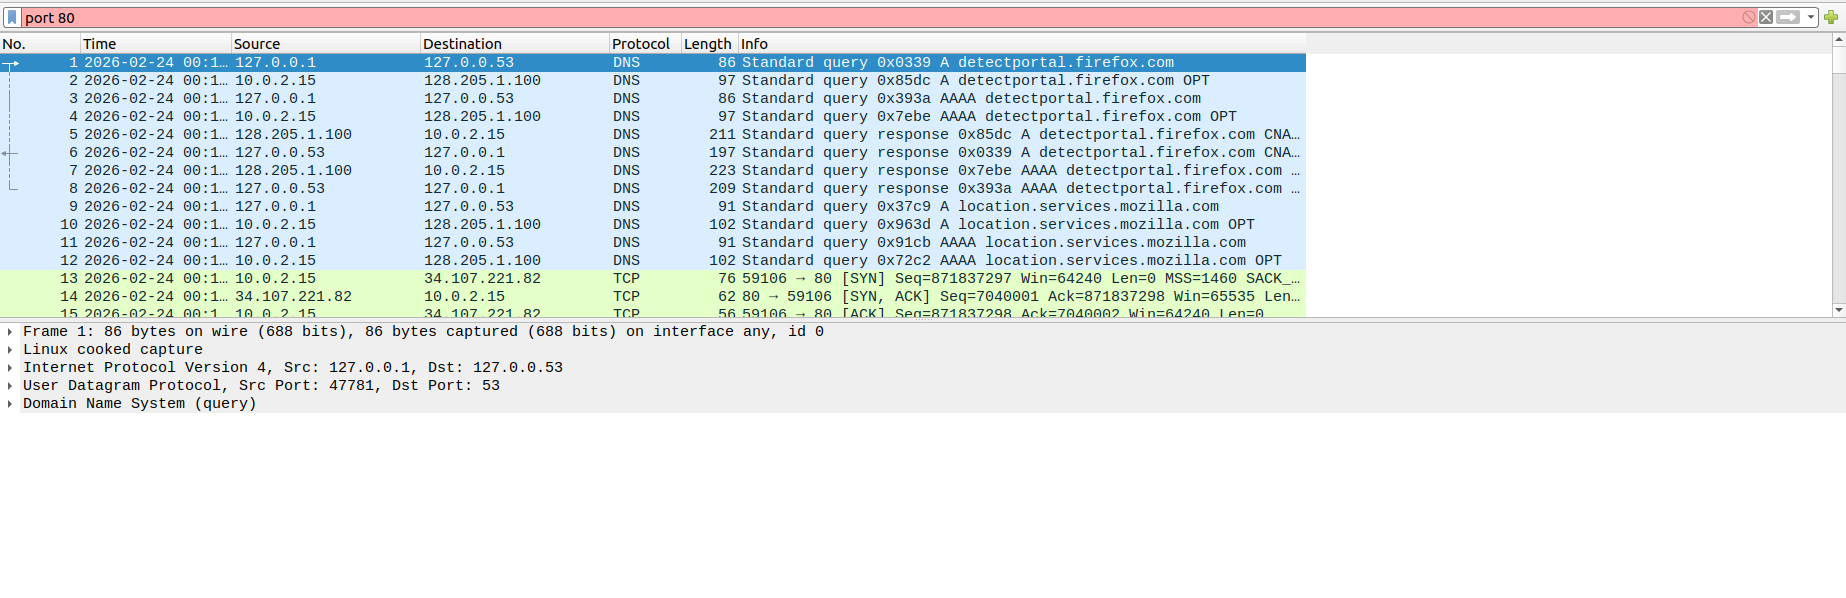
This section of the guide contains some extra features that may be helpful but are
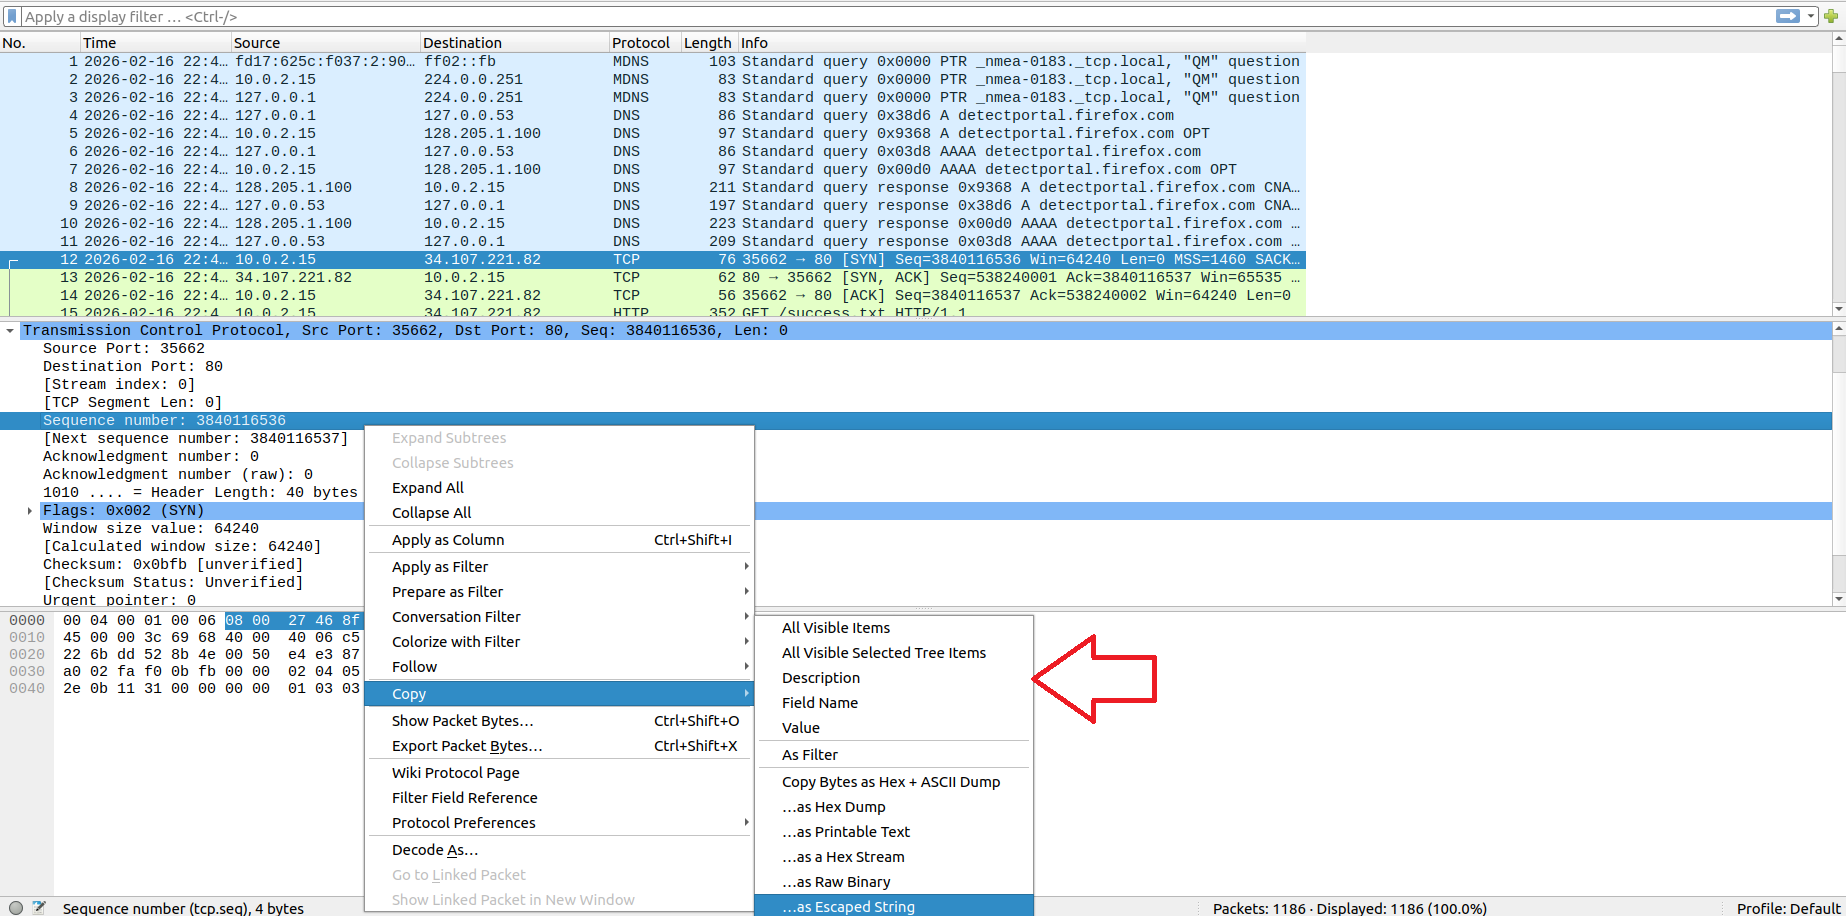
You may be thinkg -> This Guide is somewhat helpful...but can I copy and paste the sequence number since it can be error prone/tedious to type by hand? The Anwser is -> Yes, you can!
First go to the sequence number and right click on it -> select the option for copy -> then click Description
The text copied is "Sequence number: 3840116536" and stored to your clipboard and can be used to pasted into your script.
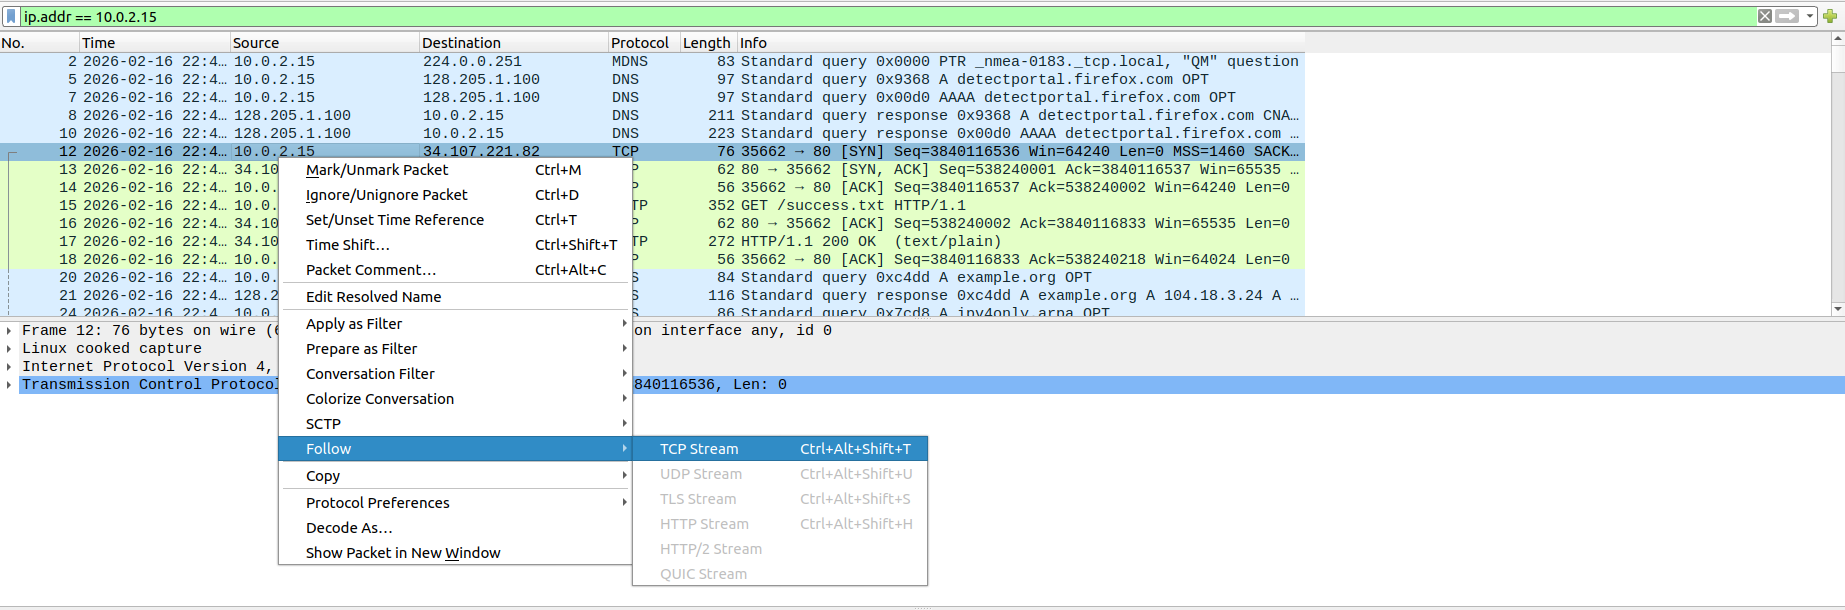
Following the example used in this guide, we can keep track of a conversation of packets. To access this we need to right click on the packet -> select the option for Follow -> then click on (Protocol)stream where (Protocol) is the replaced with an actual protocol.
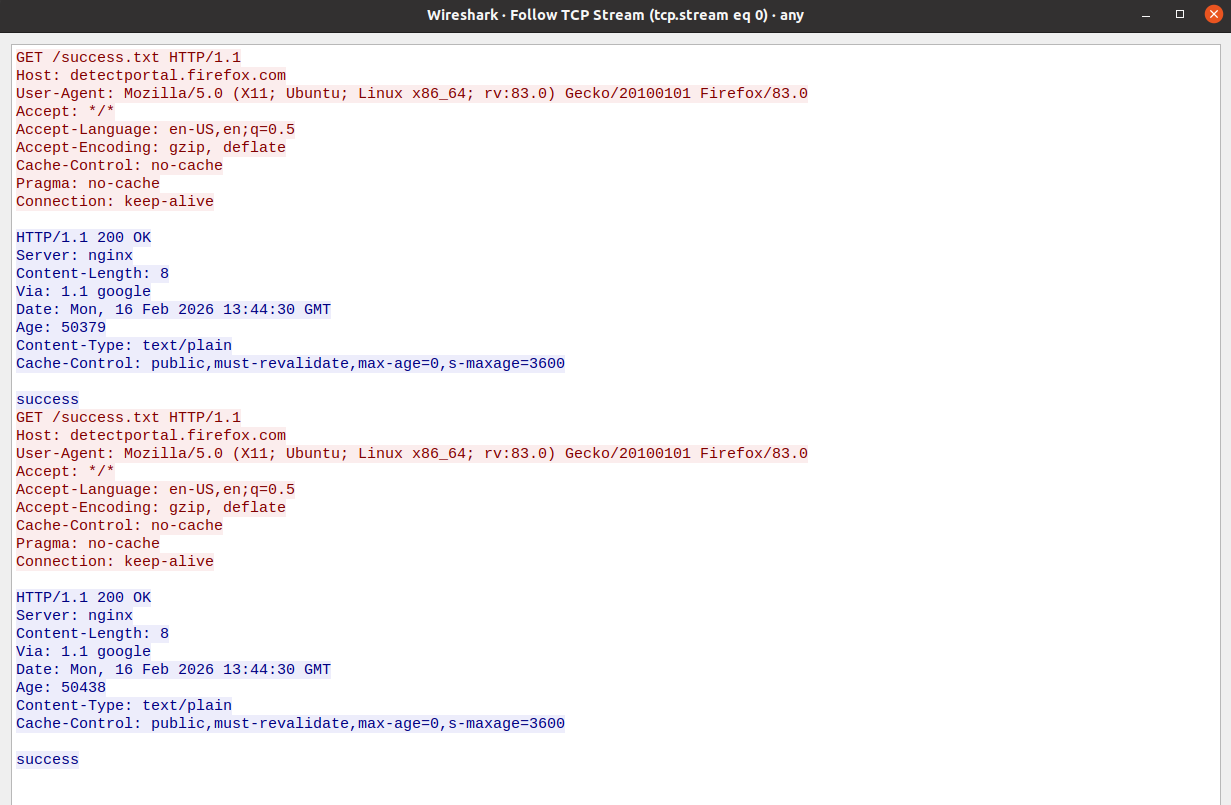
Finally, another separate windows will appear with the converstation of the packets in ASCII text and in the example below it is http GET and and 200 OK response.
If there are more features that you find useful for Wireshark that you already know or taken from the offical documentation is fair game for your labs...Good Luck and Have Fun!! XD